As part of Coresight Research’s Head-to-Head series, we compare Adidas and NIKE, the two largest sportswear companies globally. We provide insights into the two companies’ revenues, as well as sales channels, key strategies, and diversity and inclusion initiatives.
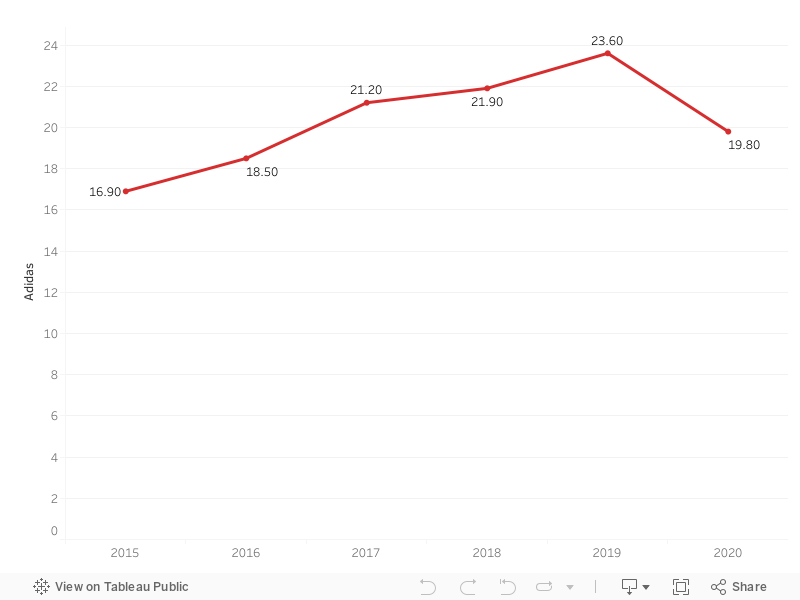
Revenue: Adidas (Bil. in Reporting Currency)
Note: Adidas’ fiscal year ends December 31; NIKE’s fiscal year ends May 31. USD conversion for Adidas revenue at a constant currency rate: $20.6 billion (FY15), $22.6 billion (FY16), $25.9 billion (FY17), $26.7 billion (FY18), $28.8 billion (FY19) and $24.2 billion (FY20).
Source: Company reports
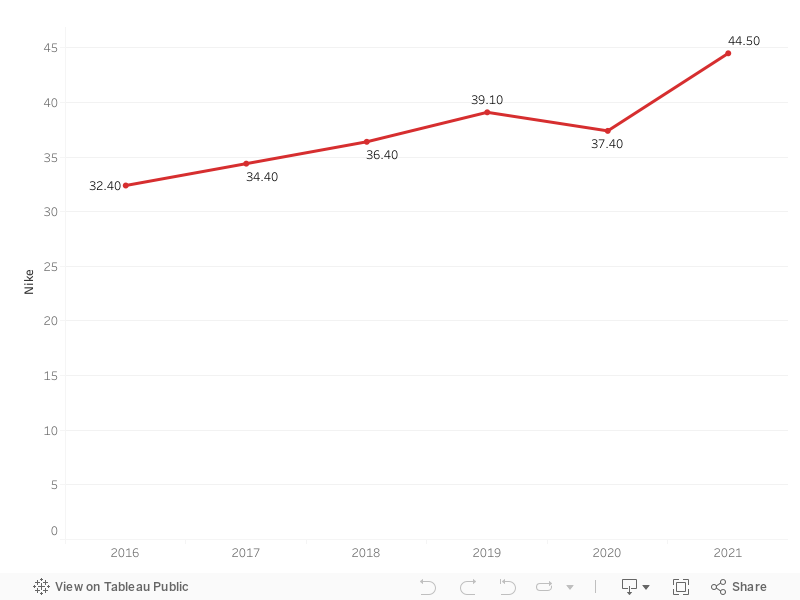
Revenue: NIKE (Bil. in Reporting Currency)
Note: Adidas’ fiscal year ends December 31; NIKE’s fiscal year ends May 31. USD conversion for Adidas revenue at a constant currency rate: $20.6 billion (FY15), $22.6 billion (FY16), $25.9 billion (FY17), $26.7 billion (FY18), $28.8 billion (FY19) and $24.2 billion (FY20).
Source: Company reports