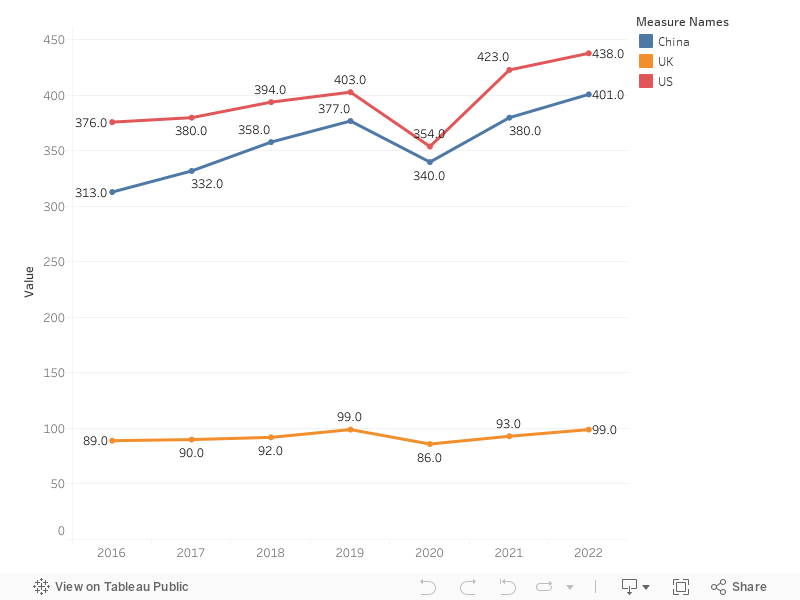
We predict that the value of China’s apparel market will surpass the US apparel market by 2025
Coresight Research sourced US and UK apparel consumer spending data to measure the US and UK apparel market. The US personal consumption expenditures are seasonally adjusted at annual rates. The UK household expenditures are not seasonally adjusted. For the China market, we sourced Euromonitor International data for better comparison.
Source: Euromonitor International Limited 2021 © All rights reserved/UK Office for National Statistics/US BEA/Coresight Research
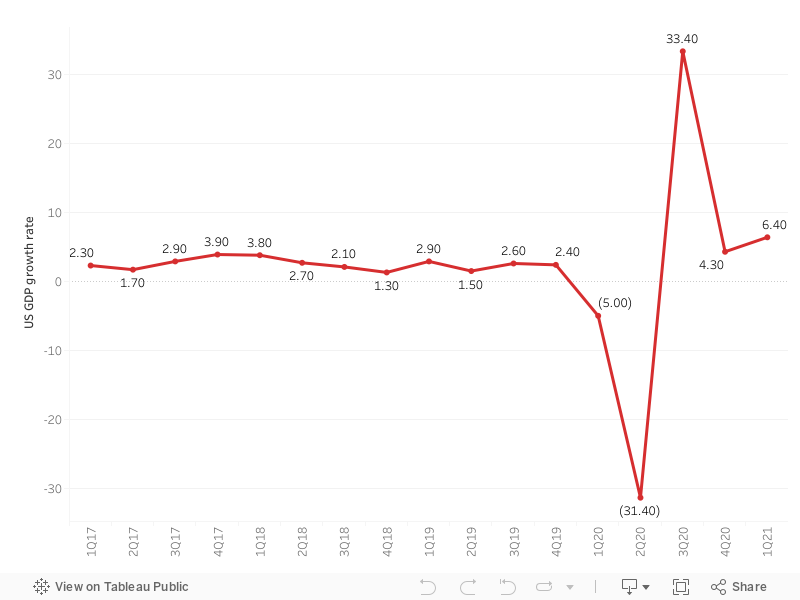
GDP: Change from Preceding Quarter (Annualized; %) – The US
Source: US BEA
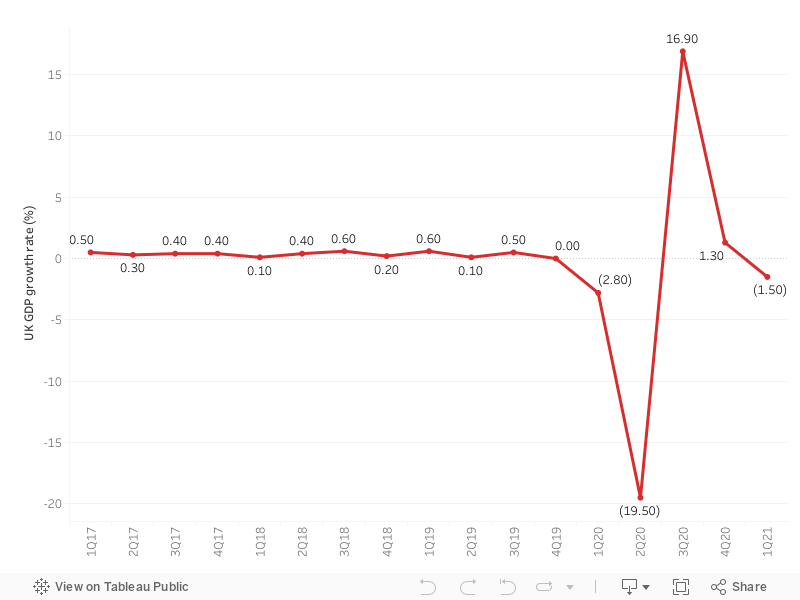
GDP: Change from Preceding Quarter (Annualized; %) – The UK
Source: UK Office for National Statistics
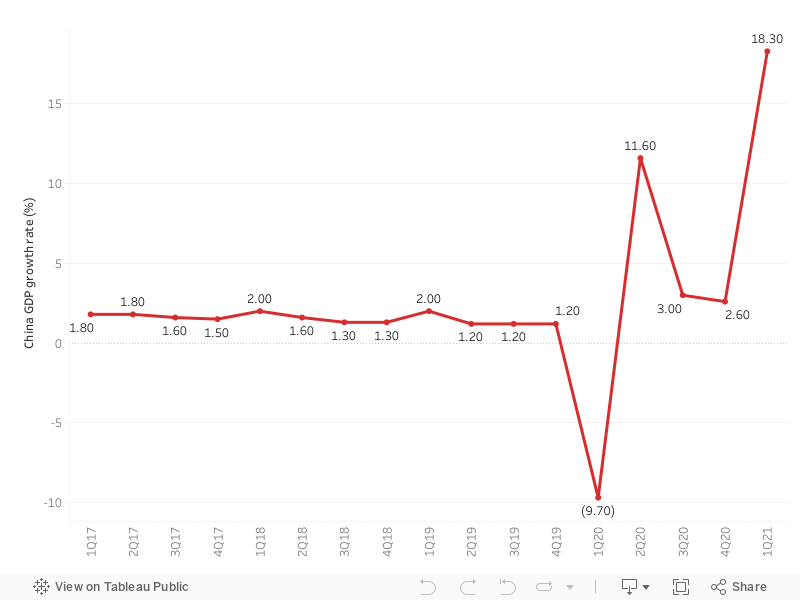
GDP: Change from Preceding Quarter (Annualized; %) – China
Source: National Bureau of Statistics of China

US, UK and China: E-Commerce Penetration Rate in the Apparel and Footwear Market (% of Total Apparel and Footwear Sales)
Note: All UK and China e-commerce data, and US e-commerce data prior to 2020, are sourced from Euromonitor (US data for 2020 and thereafter are Coresight Research estimates). For comparability, e-commerce market sizes are represented as proportions of the total apparel and footwear market sizes recorded by Euromonitor (US market size adjusted by Coresight Research for 2020 and thereafter). For the UK and US, these base market sizes differ from the consumer spending figures cited earlier in this report, which are from different source.
Source: Euromonitor International Limited 2021 © All rights reserved/Coresight Research
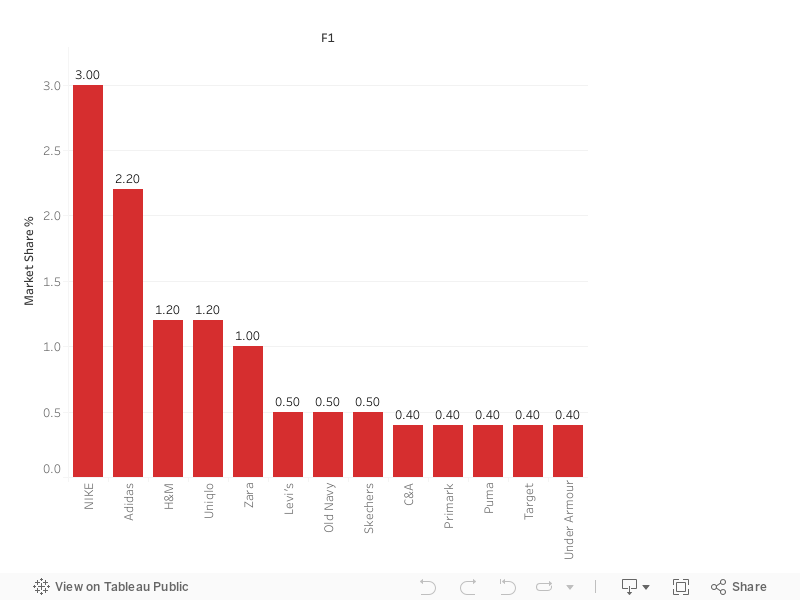
Top 10 Global Apparel and Footwear Brands: Market Share, 2020 (%)
Source: Euromonitor International Limited 2021 © All rights reserved